6/7/2007 4:49:34 PM - To evaluate the efficiency of a clinic, process cycle times are often looked at on a daily, weekly or monthly basis. Time between blood test until results reviewed by staff, time between lab visit and patient contact, or even the time from blood draw until received for analysis are all examples of cycle times that can be evaluated. The ultimate goal is to come up with a consistent process, so the patient doesn't accidently get "lost" in the system along the way, which requires a thorough understanding of the entire value stream of what the patient goes through. Healthcare System Solutions can help you understand and develop improved ways of reducing these cycle times, or help make these processes more consistent, using Lean and Six Sigma techniques.
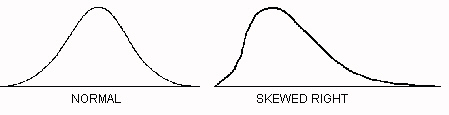
When evaluating cycle time, you should first know that time data is typically skewed to the right. What does skewed mean? If you were to plot out the time data on a histogram, you would expect to see the majority of the time around the average value, with about half of the times above the average, and half below. This is typically known as a normal or symmetric (balanced) distribution. However, you will observe a slightly different pattern for your cycle times, skewness. Skewed implies that one side of the histogram is stretched out further than the other side. Cycle time data is stretched out further to the right, and thus called 'Skewed Right' (see image below).
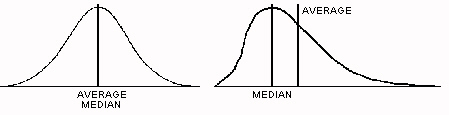
Normally, we look at the average (mean) to determine what the typical process time is for each handoff in the process. When the data is symmetric (normal), that is appropriate. However, with skewed data (as is the case with most time-based data along with housing and salary prices), the median is a more appropriate measurement of the typical time for a process. When data is skewed, the average is pulled in the direction of the skewness, and can be calculated much higher than what seems appropriate for that process. The median does not get affected as much by situations where the cycle time is extremely long (patient test results misplaced, not received before lab techs left for the day, blood draw needed to be re-done, etc). This concept is evident in the image below.
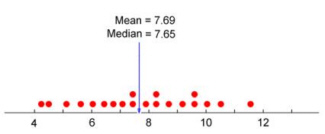
Let's look at an example. If we have a data set that is balanced around the average, then the median and average (mean) will be about the same.
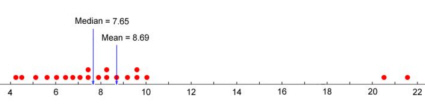
If we instead observe the two highest readings to be well beyond the original range, we can see that the median stays the same at 7.65, but the average (mean) increases up to 8.69, which pushes it further from the true middle of the data set.
Only 6 of the 20 data points are above 8.69. The median value of 7.65 would be more accurate for this data set, since it is not affected by extreme values that cause the data to be skewed.
INR Pro calculates both average time and median time, and provides a color-coded odometer chart, to give the staff a quick assessment of how that process is performing. The time can be calculated in hours or minutes, depending on which process is being measured. The ranges for each color are defined by the administrators. We recommend that these ranges be determined based on historical data.
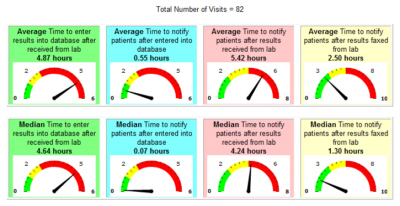
![]() If you would like to take advantage of these features with INR Pro, try our demo, or contact us for more information.
If you would like to take advantage of these features with INR Pro, try our demo, or contact us for more information.
Helping manage anticoagulation patients for over 21 years


INR Pro highlighted in latest issue of Group Practice Journal!
Latest Articles
INR Pro featured in medical group magazine
Rosendaal method for patient TTR calculations available in Excel template
New INR data reports available from your current anticoagulation system

Monitored by Site24x7
Uptime