3/28/2009 - A recent article was published in the March 2009 edition of The Joint Commission Journal on Quality and Patient Safety
titled "Measuring Quality of Oral Anticoagulation Care: Extending Quality Measurement to a New Field". This article reviews various published articles discussing different quality measurements applicable to anticoagulation clinics, and provides recommendations on how they can be used to better measure patient care, once therapy has begun. We reviewed this article, and would like to highlight some key points relevant to INR Pro.
Patient Education
Page 148 discusses results of the Community Quality Index study, and recommends using an indicator that "...measures the receipt of comprehensive education regarding warfarin therapy, or else referral to an ACC, where such education would presumably occur."
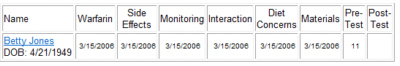
INR Pro tracks the completion date of all patient education (Warfarin/Coumadin overview, side effects, INR monitoring, interactions, diet concerns, etc), and also records any pre-test and post-tests administered. Reports are available to show the difference between the pre and post tests, to assess the impact and retention of the training to the patient.
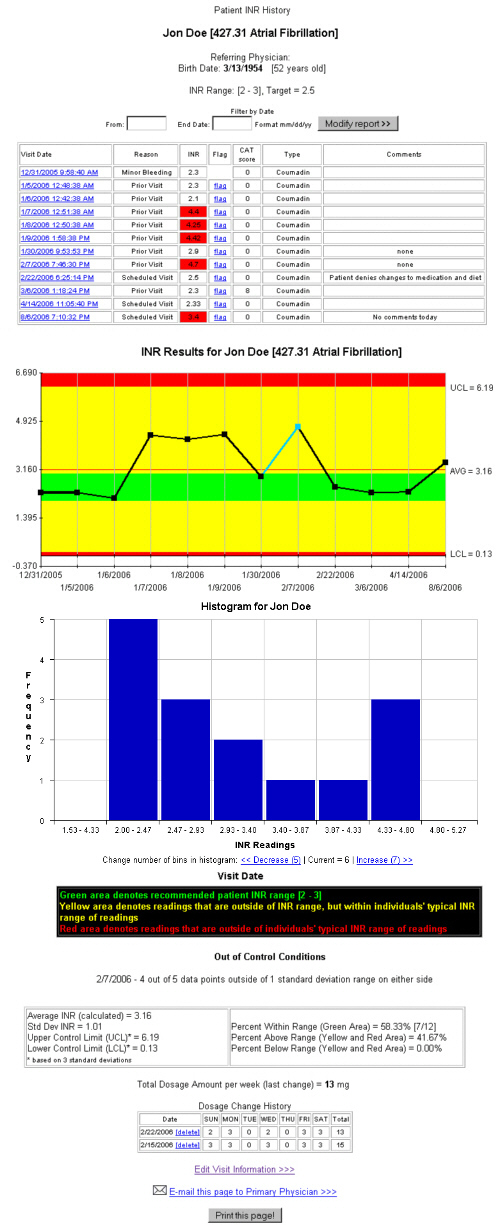
Therapeutic Time in Range (TTR)
Page 150 discusses the need for intermediate outcomes that are strongly linked to definitive outcomes (adverse events), and states that: "The most commonly used intermediate outcome in anticoagulation is TTR, which uses linear interpolation to assign an INR value to each day between INR measurements". This is also known as the Rosendaal method of Time in Range, and is not the same as calculating the percentage of visits that had values within the patient's assigned range.
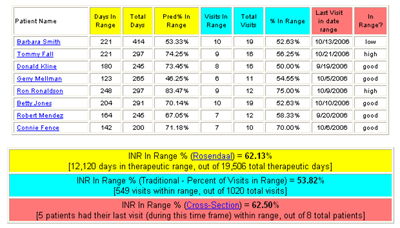
INR Pro has a summary report that calculates the therapeutic time in range using three different established methods (Rosendaal [% of therapeutic days in range], Cross Section [% of last visits in range], and traditional [% of visits in range]).
In addition, the report can be modified to allow a window around the therapeutic range. For example, expanding 0.15 on either side of a patient's range would make a typical therapeutic range of 2-3 calculate with a range of 1.85 to 3.15.
The paper goes on to mention that "our group
has recently shown that reserving dose changes for patients
whose INR is at least 0.3 outside the target range has the potential to improve percent time in the therapeutic INR range (TTR) in clinical practice." Our personal observations and research also supports this statement, and would recommend that any reading within 0.2 of the therapeutic range be heavily scrutinized (review the patient's INR control chart) before a dose change is made.
Calculating Standard Deviation
Also related to intermediate outcomes, the paper highlights another INR variability measure that has been used to predict adverse events.
"This measure is calculated by finding the mean INR value for each patient and then the standard deviation around that mean; the standard deviation is a measure of INR variability."
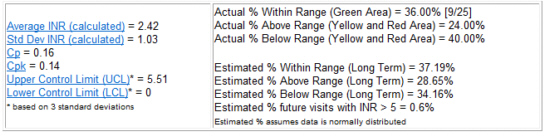
INR Pro provides numerous statistical calculations, including mean, standard deviation, Cp, Cpk and predicted percent within, and outside of, therapeutic range (prediction of long term ability to stay within range). We also recently added a prediction for the % of future visits that might have an INR > 5.0, which ties directly to predicting adverse events. In addition, a CAT score was developed and implemented, in order to assess each patient's compliance to the recommended guidelines after each test. This allows the clinic to track how disciplined that patient is. Patients with higher compliance scores will more likely stay in therapeutic range.
INR Pro also displays a control chart of the patient's historical INR readings, with statistically calculated control limits that are 2 or 3 (user-defined) standard deviations from the mean, to show the typical variability in INR values for that patient.
Hiding Data Points
Page 151 discusses the impact of interpreting Therapeutic Time in Range (TTR) data using all data points, where some INR readings may be taken prior to an upcoming procedures (as a baseline), and may not be a true indication of a typical INR reading for that patient.
"...some ACCs may intentionally document low INR values prior to procedures, a practice that would reduce TTR but would not imply inferior quality of care. Deleting INR values proximal to an intentional interruption of therapy may improve the performance of TTR as a quality indicator."
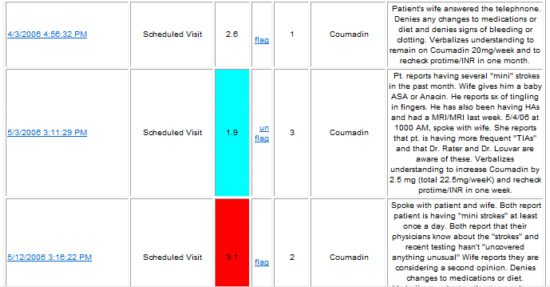
INR Pro allows you to "flag" certain data points that you do not want included in the analysis or calculations.
To "flag" a data point, simply click the flag link next to the reading, which will turn it light blue, and remove it from the charts and analysis. To place the point back into analysis, click the "unflag" link.
The entire article can be accessed from the Joint Commission website.
![]() If you would like to take advantage of these features with INR Pro, try our demo, or contact us for more information.
If you would like to take advantage of these features with INR Pro, try our demo, or contact us for more information.
Helping manage anticoagulation patients for over 21 years


INR Pro highlighted in latest issue of Group Practice Journal!
Latest Articles
INR Pro featured in medical group magazine
Rosendaal method for patient TTR calculations available in Excel template
New INR data reports available from your current anticoagulation system

Monitored by Site24x7
Uptime