7/21/2009 - In late 2008, the CAT Clinic in Cedar Rapids, IA began a patient self-testing initiative. Home monitors were sent to eligible patients, and training was provided to patients on how to take proper measurements. The patients were also shown how to enter their INR results into INR Pro, so the CAT Clinic could continue to monitor and manage the patients.
In July of this year, the CAT Clinic began to notice that the results from the patients who were self-testing seemed to be improved from their results prior to self-testing. The clinic wanted to statistically quantify the data, to see if their observations were valid, or just wishful thinking. HSS helped modify the reporting features within INR Pro to make the data more accessible for this type of analysis, and provided statistical assistance to the clinic.
In order to accurately measure the change, without mixing in patient differences, the data needs to be compared on a patient by patient basis, and rolled up to an overall summary. Since time in range % is a yes or no result, it is often times difficult to find strong statistical significance, even if a difference exists. This is due to the lack of granularity in the data. It is also difficult to separate the patient differences out of the data, to see if each patient improved. That being said, a comparison of time in range % was performed. If the data shows a significant improvement, we can feel very confident that a true improvement exists, because our data includes operator variation and differences in the results.
We first looked at all Scheduled Visits (visits reviewed in the CAT clinic) for those patients who are current self-test patients that has blood draws performed at a lab (not at home). There were 24,324 visits, of which 15,507 were in-range (63.76%).
We next took the same self-test patients, and looked at just their home-testing results. There were 10,745 visits, of which 7,504 were in-range (69.84%)
The Minitab statistical software analysis is below, showing a p-value of 0.000, which means that there is a statistically significant improvement in time in range % for patients who switch to self-testing (about 6% improvement).
Two Proportions Test Comparing Time In Range % Before and After Self-Testing Difference = p (1) - p (2) However, using binomial data (time in range %) is not ideal, and may be underestimating the improvements. What is preferred is to measure the actual INR values, and see if there is some improvement in those results. The only problem is that not all patients have the same therapeutic range, so we need to normalize the data so that each INR is compared to each patients' individual therapeutic range. The best way to normalize is to determine the target INR value (usually the middle of the therapeutic range), and calculate how far each INR result is from the target. For example, if a patient has a therapeutic range of 2.5 - 3.5, then their target should be 3.0. If there next INR is 3.15, then the normalized value is +0.15. These normalized values can then be compared to other patients. The closer the normalized value is to zero, the better. INR Pro allows you to run a report that normalizes the INR results for this very purpose.
We repeated the same data collection as before, but instead of comparing the time in range % by patient, we compared the average INR difference from target (the normalized INR data before and after self-testing began). We could also look at the standard deviation of the differences from target (normalized data), to see if the variation in INR readings has changed since self-testing began.
We use a Paired t-test to appropriately take out the patient to patient differences, so we can solely focus our analysis on whether each patient saw an improvement in their normalized INR value, or if the standard deviation of the normalized INR had significantly changed. Basically, we are comparing the average normalized INR value before and after, and recording whether the average increased or decreased. This difference will be averaged across all patients, to determine if most patients are seeing improved results closer to zero after self-testing. The same thing will be done with the standard deviations, and also compared to see if the normalized values are getting closer to zero. There will be two statistical tests performed, one for the average INR, and the second for the variation in INR.
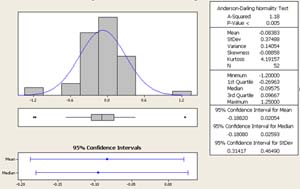
When analyzing numerical data, one should first look at the data graphically to see if the data looks correct and matches your assumptions, and to see if there are any outliers that need some investigation.
Figure 1. Histogram of Normalized INR values for Self-Testing Patients Before Self-Testing Began
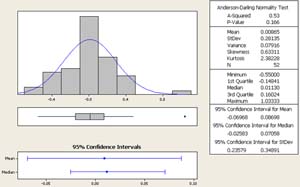
Figure 2. Histogram of Normalized INR values for Self-Testing Patients After Self-Testing Began
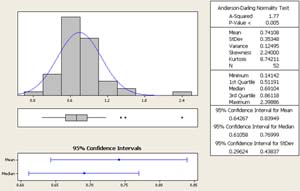
Figure 3. Histogram of Standard Deviation of Normalized INR values for Self-Testing Patients Before Self-Testing Began
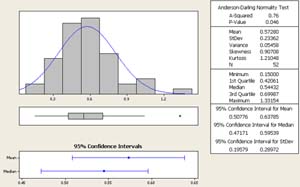
Figure 4. Histogram of Standard Deviation of Normalized INR values for Self-Testing Patients After Self-Testing Began
The data appears to be normally distributed, which helps meet an assumption for our statistical analysis. There did not appear to be any major outliers in the data, so we feel comfortable proceeding with the tests.
We will run two statistical tests: 1) comparing average differences from normalized INR values and 2) comparing standard deviation differences of normalized INR values
We can look at both tests graphically first, to see if there is a possibility that a difference exists. This helps reaffirm any statistical conclusions we make from the analysis.
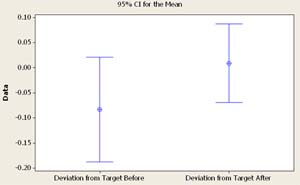
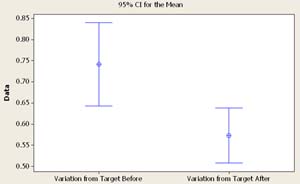
Figure 5. 95% Confidence Interval Plot comparing Standard Deviation of Normalized INR values for Self-Testing Patients Before and After Self-Testing Began
Figure 6. 95% Confidence Interval Plot comparing Standard Deviation of Normalized INR values for Self-Testing Patients Before and After Self-Testing Began
Test 1: Change in Average INR results.
Paired T for Deviation from Target Before - Deviation from Target After
95% CI for mean difference: (-0.2083, 0.0233) The hypothesis question we are trying to conclude is: Does the average normalized INR value change after a patient starts self-testing? Another way to state it: Does the normalized INR value get closer to target when the patient starts self-testing? We look at the p-value to answer that question. If the p-value is less than 0.05, then we can conclude that there is a significant difference in normalized INR values before and after self-testing.
The p-value is 0.115, therefore we do not have enough evidence to say there is a statistical improvement to the normalized INR value after self-testing, even though our interval plot looks like there is a difference, and our average (mean) drops from -0.0838 before, to 0.0086 after self-testing. If we continue to monitor these results with more patients, I believe there will a statistical significance. Irregardless, the results are close to being significant, so they look very encouraging with a little more data.
Test 2: Change in Variation of INR results.
Paired T for Variation from Target Before - Variation from Target After 95% CI for mean difference: (0.0788, 0.2578) The hypothesis question we are trying to conclude is: Does the standard deviation of the normalized INR values change after a patient starts self-testing? Another way to state it: Does the patient show less variation in INR results (more consistent) after self-testing?
The p-value is 0.000, therefore we have enough evidence to say there is a statistical change in the standard deviation of the normalized INR values after self-testing. This is evident in our interval plot, and we can see that our average standard deviation (mean) drops from 0.7411 before, to 0.5728 after self-testing. Therefore, the patient is more consistent after self-testing.
So what is our overall conclusion? Based on our analysis, we can say with 95% confidence that the variation in INR readings is significantly less after the patient begins self-testing, but we do not have enough evidence to conclude that their INR results get closer to target, although our results to date lean heavily towards that conclusion.
Please contact us if you have any questions on how we performed our analysis, collected our data, or if you want help on performing a similar study for your clinic.
Sample      X     N Sample p

1       15507 24324 0.637519

2        7504 10745 0.698371
Estimate for difference: -0.0608528
95% CI for difference: (-0.0714266, -0.0502791)
Test for difference = 0 (vs not = 0): Z = -11.28 P-Value = 0.000
Fisher's exact test: P-Value = 0.000
                               N     Mean   StDev  SE Mean

Deviation from Target Before  52  -0.0838  0.3749   0.0520

Deviation from Target After   52   0.0086  0.2814   0.0390

Difference                    52  -0.0925  0.4159   0.0577
T-Test of mean difference = 0 (vs not = 0): T-Value = -1.60 P-Value = 0.115
                                N    Mean   StDev  SE Mean

Variation from Target Before   52  0.7411  0.3535   0.0490

Variation from Target After    52  0.5728  0.2336   0.0324

Difference                     52  0.1683  0.3215   0.0446
T-Test of mean difference = 0 (vs not = 0): T-Value = 3.77 P-Value = 0.000
![]() If you would like to take advantage of these features with INR Pro, try our demo, or contact us for more information.
If you would like to take advantage of these features with INR Pro, try our demo, or contact us for more information.
Helping manage anticoagulation patients for over 21 years


INR Pro highlighted in latest issue of Group Practice Journal!
Latest Articles
INR Pro featured in medical group magazine
Rosendaal method for patient TTR calculations available in Excel template
New INR data reports available from your current anticoagulation system

Monitored by Site24x7
Uptime