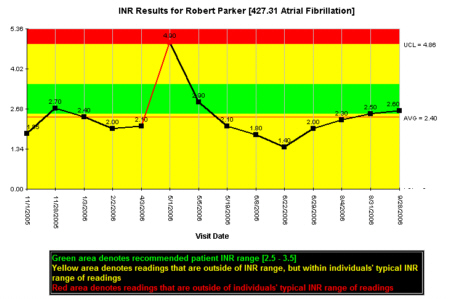
5/26/2007 4:52:38 PM - Many anticoagulation management systems provide a run chart of the patient's historical INR results, so you can remember how each patient has evolved in their therapy, to see what range they typically fall within. However, many times the patient's INR will fall well above or below their typical levels, and this can be an indication of a "special" cause or circumstance that led to this excessively high or low reading.
Before we dig into these "special" situations, we need to first understand what should be considered "excessive". INR Pro goes one step beyond the run chart, by adding control limits to the patient INR history chart. These control limits are determined by calculating the standard deviation from the historical results (INR Pro allows you to enter historical readings, or will import your old records into our system to retain those readings). Industy practice uses 3 standard deviations above and below the calculated average to determing the upper and lower control limits. Any INR reading that falls above the upper control limit, or below the lower control limit is considered excessive, or a "special" cause.
The control limits are denoted in yellow on the control chart, while the green indicates the patient's recommended therapeutic range. The red is the space outside of the yellow control limit range. In the chart below, the control limits (yellow area) range from 0 to 4.85, based on all the readings obtained from that patient so far.
Any data points in the red area are considered out of control. From the chart above, the 4.90 reading on 5/1/2006 is considered an outlier or out of control point. This means we should pay special attention to this reading, since it was not a value we would normally expect to see for this patient, based on their historical results to date. You should also remember that these out of control readings are not related at all to the patient's therapeutic range, rather it is solely based on the patient's historical results. These out of control readings are typically an indication that something different happened before, or during this reading, that caused it to be so unique. Examples include:
So what are the implications of identifying a "special" cause? If your investigation determines that something did happen that is out of the ordinary, then you should not make a permanent adjustment to the patient's dosing. Temporary changes can be made to get the patient back into therapeutic range, along with a follow-up retest, however, we should avoid making an official dose change, since we have no evidence that the dosing amounts are incorrect.
What happens if the patient can't remember anything wrong, or there was nothing in the process that caused it to be unique? There are two possibilities.
1) There really isn't anything wrong, and it was just random chance that the reading was that much higher or lower than the limits. The closer that data point is to the limits, the more likely that there was nothing unique about the reading. When using 3 standard deviations for the chart limits, there is a 0.3% chance of getting a reading outside of the limits due to chance (where probably nothing was wrong). Using 2 standard deviations, there is a greater chance, around 5%.
2) The reason for the special reading has not been discovered yet. Keep questioning the patient. Ask them about their week, review the CAT score assessments with them, and check with the labs to make sure everything is working properly. Ask their caregiver, their spouse or their phyisician. Often times, they will not remember, but after they think about it for a while, they might recall what happened.
Why don't I just ask them about every reading outside of their therapeutic range? Readings outside of a range are not based upon the patient's historical data. Therefore they do not take into account each patient individually. Only the control limits are setup to identify unique readings that require investigation for that specific patient. You will waste your time (and the patient's time) if you investigate these.
For convenience, INR Pro allows you to select either 2 or 3 standard deviations for your control charts, depending on how often you would like to get potential out of control points. Finally, one should know that the more historical data for each patient that is available, the better and more accurate the calculation of control limits. Ideally, a sample of 20 prior INR readings should be obtained before you can be truly confident of identifying an out of control result. 
![]() If you would like to take advantage of these features with INR Pro, try our demo, or contact us for more information.
If you would like to take advantage of these features with INR Pro, try our demo, or contact us for more information.

Helping manage anticoagulation patients for over 20 years


INR Pro highlighted in latest issue of Group Practice Journal!
Latest Articles
INR Pro featured in medical group magazine
Rosendaal method for patient TTR calculations available in Excel template
New INR data reports available from your current anticoagulation system

Monitored by Site24x7
Uptime